


Art, Antiquities, and Collectibles
Forensic Analysis of Art, Antiquities, and Collectibles
Jump to:
Approach – Experience – Research – Reference Collections – Equipment – Examination – Ultraviolet – Infrared – Radiography – Sample Collection – Non-Destructive Analysis – Colorant Identification – Light Microscopy – Elemental Analysis – SEM-EDS – XRF – Raman Microspectroscopy – Binder Identification – Paper and Wood – Cross Section Analysis – Ink and Dyes – Debris and Residues – Transmission Electron Microscopy and Beyond – Collectibles – Reporting – Litigation and Testimony Support
Our Approach
Microtrace has collected and analyzed samples from artworks attributed to artists including Monet, Picasso, Constable, Calder, Dali, Kandinsky, Klein, among many others. We have also analyzed antiquities ranging from the stone age to the bronze age, as well as more recent memorabilia attributed to historical figures that include Abraham Lincoln, Adolf Hitler, Babe Ruth, “Shoeless Joe” Jackson, Joe DiMaggio, and Lou Gehrig. We have been consulted by a wide range of businesses from world class museums and conservators to auction houses, dealers, and private collections. Our detailed reports are intended to withstand the rigors of both scientific and legal scrutiny. Based upon the analysis of minute amounts of material, our reports provide detailed factual information and insights into the composition of these objects.
The objective, scientific analysis of art, antiquities, and collectibles conducted by Microtrace offers an orthogonal approach to stylistic examinations, signature analyses, and provenance investigations. Scientific analyses hold the potential to provide unequivocal factual information that can, in many instances, provide additional clarification for controversial or disputed works. Such information can provide support to an investigation into an objects provenance or provide evidence for inclusion in a catalogue raisonné.
We are often asked to provide details of our approach, and to that end, this represents an overview of our capabilities. Any given analysis draws from aspects of the approach listed below. We invite you to review this to get a sense of the level of detail that we provide in our scientific analyses and reports.
Passion
We have looked at lamp shades allegedly made of human skin, bats used in pivotal moments of baseball history, art that has been flown into space, and works ranging from the bronze age to modern sculptures. We have had the honor of studying, first hand, paintings attributed to Monet, Picasso, Dali, Chagall, Calder and many others. Each has a fascinating story, and our analyses provide – to us at least – fascinating new insights. We always look forward to what the next phone call may bring.
Experience
Microtrace staff have developed an immense amount of experience in obtaining a wealth of information from minute particles. This derives from the unique combination of clients and industries that we serve. For instance, Microtrace routinely works in the criminal forensic world of trace evidence analysis where we support investigations by the police and prosecuting agencies as well as defense and post conviction teams. Cases that we have made contributions to include the Green River Murders, the Atlanta Child Murders, and Making a Murder (Netflix). Often these cases involve the analysis of paint, typically in the form of automotive or architectural coatings. In other instances, we study ink or toner on questioned documents – or the construction of the documents themselves. This has included pages from Ivan Demjanjuk’s dienstausweis (travel papers), who was tried for war crimes and accused of being Ivan the Terrible.
The realm of trace evidence analysis utilizes microanalytical instruments and skills that are directly applicable to forensic art investigations. To this end, we have developed and honed our skills for extracting a maximal amount of information from the most minute specimens. Working with industrial clients, many of whom manufacture pigments, dyes, inks, paints, and papers, provides further insights into new manners of analysis and more intricate realms of interpretation.
Research
We also conduct both internal and federally sponsored research. This has included pioneering research on the preparation and analysis of pigments, dyes, and microscopic and nanotrace evidence. Our approaches to pigment identification are based upon a broad combination of analytical methods that are aimed at providing the most comprehensive identification picture possible. This has led to various presentations and publications, including this one, which illustrates the depth of information that can be obtained from a particle of paint. We have studied ink dating, and recently, a pair of interns conducted detailed analyses of pre-ballpoint pen inks, which provide new avenues for interpreting the analysis of historical ink samples. Much of our research has been published and presented at meetings around the world.
Reference Collections
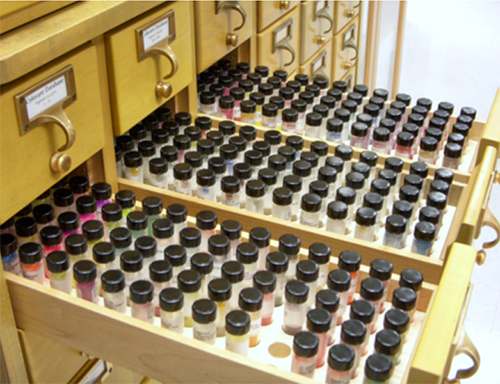
A small sampling of the Microtrace colorant reference collection, which consists of over 30,000 physical samples.
Our analyses of paint, ink, pigments, and dyes are heavily based upon knowledge, experience, and samples drawn from our immense physical reference collections. Presently, our collections include several thousand pigment samples, and several tens of thousands of dye samples. These samples are present both in their raw powder forms, as well as in finished products, and range from some of the newest commercially important colorants to pigments rarely used after the 19th century. These colorants represent artistic, architectural, automotive, ink, and even food colors. In itself, this has led to fascinating findings, such the discoveries of misidentified references in commonly used databases of artist pigments; this research led to the study of Indian Yellow pigment, which was originally produced from the urine of cows that were fed a strict diet of mango leaves. Other fascinating findings include solving an industrial corrosion issue, in which the corrosion product was compositionally equivalent to an obscure blue pigment.
Our extensive study of colorants is of immense value when interpreting data from multiple analytical methods. For instance, there are various ways to name a colorant: A common name like vermillion, a chemical formula (HgS), a chemical name (mercury sulfide), the mineral name (cinnabar), a Colour Index name (Pigment Red 106 / PR 106), a Colour Index constitution number (12925), and a CAS number (1344-48-5), to name a few. Then, there are trade names used by different manufacturers, like Crimson Antimony Sulfide by Noil Chemical & Color Works, which was used to market vermillion pigment, despite the fact that this pigment does not contain Antimony. Since vermillion is a toxic pigment, it is now substituted by entirely different compounds. This is one of the more straightforward inorganic pigments. Other colorants may have no published structure (often, modern dyes fall into this category to protect a trade secret), names may be ambiguous (pigment white 6 is titanium dioxide which refers to both rutile and anatase polymorphs), or they may represent more than one chemical composition. Being able to track down this information requires authenticated reference materials, the ability to interpret analytical data beyond a database match, and persistence – this is something we truly enjoy figuring out. There are times when the best that can be done is to provide a general classification of a pigment. However, just understanding how well you know the answer is essential, so as to not be misleading.
Equipment
While some labs that specialize in art analysis purchase one or two pieces of equipment, our laboratory has been purpose built for interrogating and extracting as much information as possible from samples. We own and maintain research-grade equipment, combining practical experience from the use of our instruments with a solid foundational understanding of the theory behind their design and use, we are not only experts in the material that we study, but experts in the collection and interpretation of analytical data. To that end, we have critically reviewed reports from opposing experts in numerous legal cases to evaluate the extent, significance, and validity of their conclusions. Some of the available equipment at our laboratory includes:
- Infrared imaging (transmitted and reflected)
- Ultraviolet imaging (long and short wave UV)
- Radiography
- Microtomy
- Ultramicrotomy
- Polarized light microscopy (PLM)
- Oil immersion microscopy
- Fluorescence microscopy
- Cathodoluminescence microscopy
- UV-Vis microspectrophotometry (MSP)
- Raman microspectroscopy (Raman) and surface enhanced resonance spectroscopy (SERS)
- Infrared microspectroscopy (micro-FTIR)
- Scanning electron microscopy with energy dispersive X-ray spectroscopy (SEM-EDS)
- Micro X-ray fluorescence spectroscopy (micro-XRF)
- Gas chromatography – mass spectrometry (GC-MS)
- Pyrolysis gas chromatography – mass spectrometry (py-GC-MS)
- Ultra performance liquid chromatography – high resolution mass spectrometry (UPLC-HRMS)
- Transmission electron microscopy with selected area electron diffraction and energy dispersive X-ray spectroscopy (TEM-EDS with SAED)
- X-ray diffraction (XRD)
While you can certainly read about each piece of equipment on our website, the following provides a brief bit of information about our approach and how they specifically relate to analysis in the world of art and collectibles.
Examination
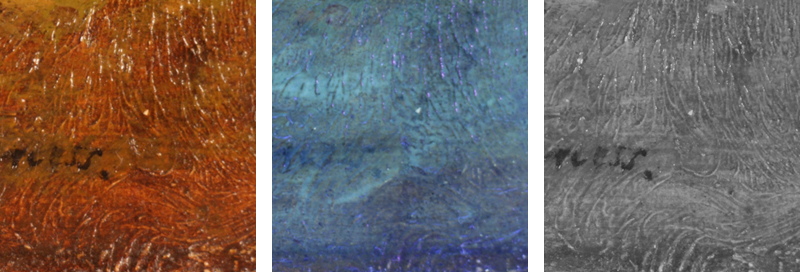
Above – Visible (left), UV (middle) and IR (right) images showing part of a signature on an oil painting.
Analyses typically begin with an overview examination that utilizes illumination conditions that spans the ultraviolet to visible to near infrared regions of the electromagnetic spectrum.
Ultraviolet and Fluorescence Imaging
Macroscopically, UV illumination can provide image contrast that provides insight into alterations, repairs, and retouched paint. Fluorescence resulting from ultraviolet illumination can also provide insight into the presence and distribution of pigments, binders, optical brighteners, and varnishes that may be present in a work.
Infrared Imaging
Infrared imaging, which can be collected in both transmittance and reflectance modes can provide complimentary information about the construction of a painting. Often, brushstrokes from varnish layers provide contrast in infrared imaging. In the images shown above, the signature is distinct in the visible and IR images; however, the UV image shows a brighter ring of blue-white fluorescence around the signature which suggests that a solvent may have been used to alter this part of the work.

Above – Visible (left), UV (middle) and IR (right) images showing part of a signature on an oil painting.
Infrared imaging can also bring out obscured writing. in the visible image above (left), a wooden stretcher on the rear of a painting appears to be blank; however, infrared imaging shows the presence of a distinct signature in pencil.
Radiography
Microtrace has the capability to X-ray your art, which can lead to fascinating revelations about the history of a work.
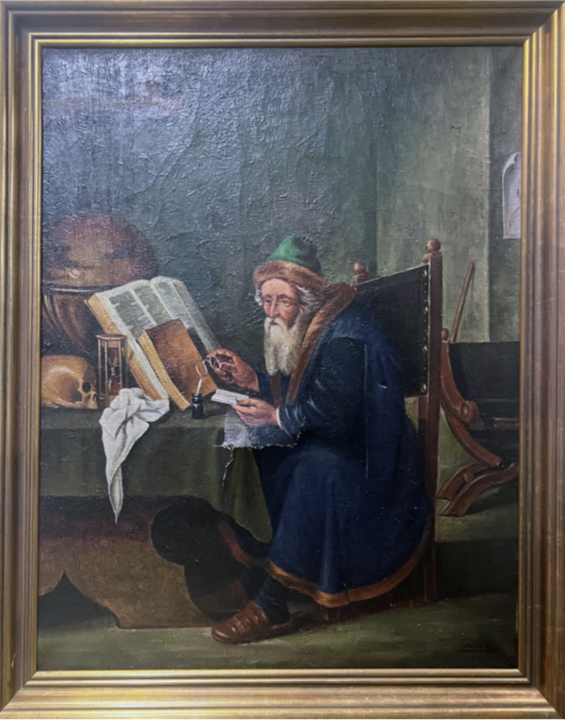
Above – Visible image of an alchemical painting.
Radiography (X-ray imaging) can reveal a wide range of information such as alternations and even underpaintings. The above painting of an alchemist appears relatively unremarkable; however, an X-ray image of the painting collected at Microtrace shows something much more interesting.
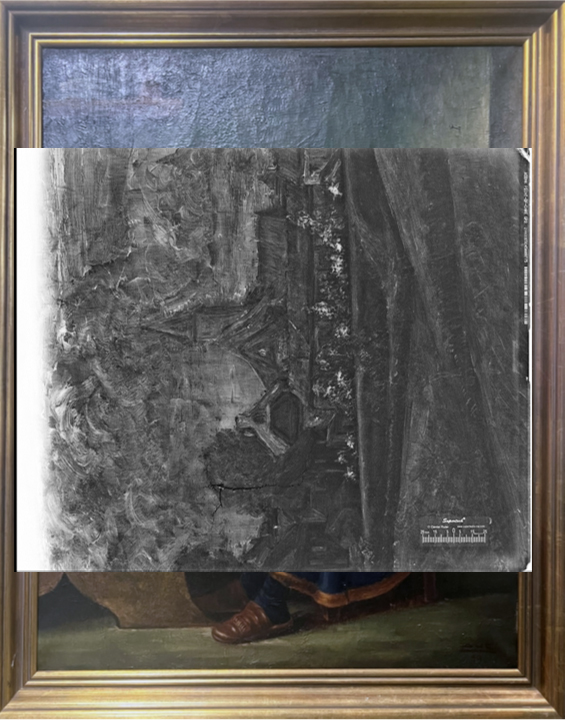
Visible image of an alchemical painting with an x-ray of the same painting overlaid.
The X-ray image collected from the central portion of the alchemical painting shows a contrast that does not correspond to the alchemical image.
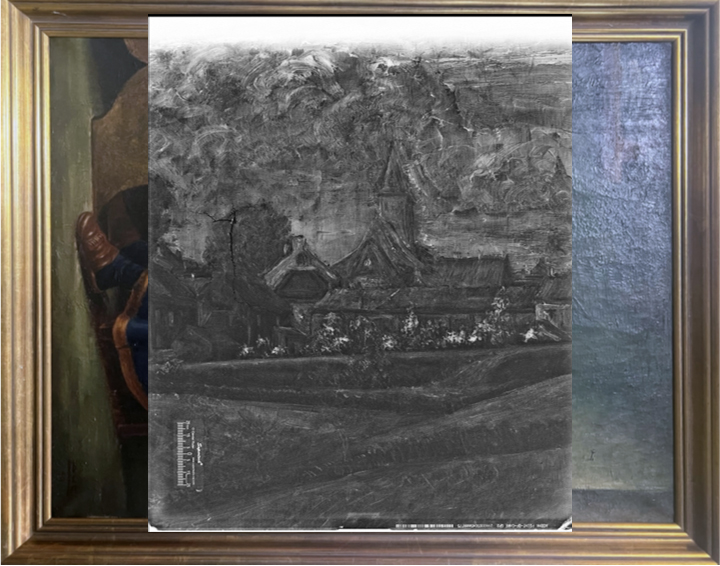
Under the alchemical scene, an x-ray reveals a landscape scene that had been previously painted.
Rotating the image from portrait to landscape shows that a landscape scene was originally painted on the canvas. Certainly not all art contains an entirely different scene beneath what is visible under ordinary white light; however, our investigations of artwork by radiography have shown a variety of interesting alterations to earlier versions of faces or scenes.
Minute Samples

While an examination based around alternate light sources can provide useful textural information, microanalysis can provide remarkably specific information about the identity and composition of various components in a work.
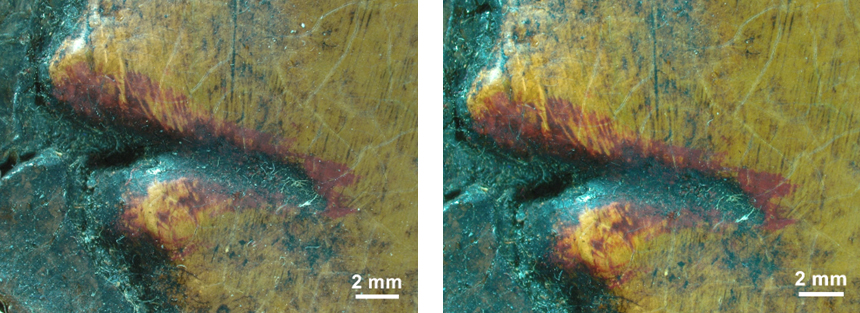
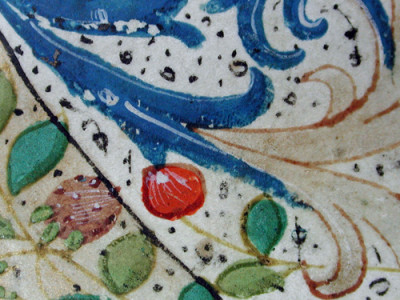
Area of interest, shown before (left) and after (right) taking a sample of the red paint. Hint: The sample was collected from an location that is roughly centered in the image.
Generally speaking, it is optimal, if not necessary, to collect a minute sample from various areas of the object for analysis. While analysis can be conducted in place (in situ analysis), we have consistently found that it is possible to obtain more information from a minute sample that has been isolated from the artwork. The samples we collect are minute. For example, the image shown above is an area of a painting on wood shown before (left) and after sampling some of the red paint. This image was taken under a stereo microscope, and it is challenging to find the location from which the sample was taken. Can you find it? There are other instances, where the sample collection area can be seen – typically with difficulty – however, we generally focus on collecting a sample from area where the material removed will be less noticeable. This may include an area where a buildup of paint exists, the margin of a feature, or an already damaged area. This is true whether we are collecting from a signature, painting, or sculpture. In some instances, the handling of a delicate or decomposing artifact is sufficient to release enough material for our analyses.
An example of the amount of a typical paint sample collected from an area of a painting. In more sensitive areas, such as a signature, only a fraction of this material is collected.
Non Destructive – In situ Analysis
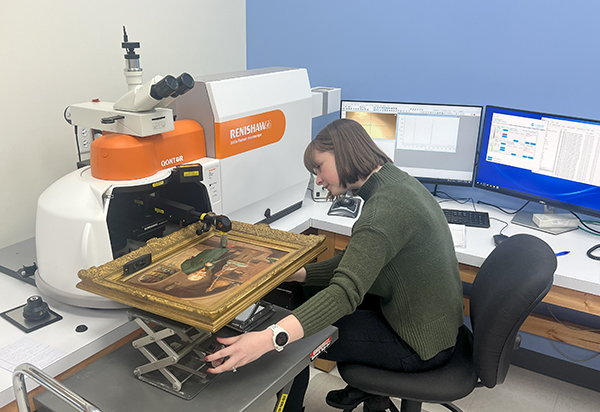
In situ analysis of a painting by Raman microspectroscopy at Microtrace.
In some events, circumstances preclude the direct collection of a sample. For instance, collection policies of museums will not permit the taking of samples. In such cases, in situ analyses are conducted. Shown above is one of our scientists conducting a direct, in situ analysis by Raman microspectroscopy on an area of a painting. Microtrace is equipped for and has conducted numerous in situ analyses of fine art when sampling is not permitted. The results of such analyses can be probative and useful; however, they also come with limitations – which often can’t be known until an analysis is conducted. For instance, fluorescence from a pigment or, more commonly, the sample matrix, can inhibit or eliminate the value of Raman microspectroscopy. Such effects can often be mitigated when isolated samples are used.
Colorant Identification
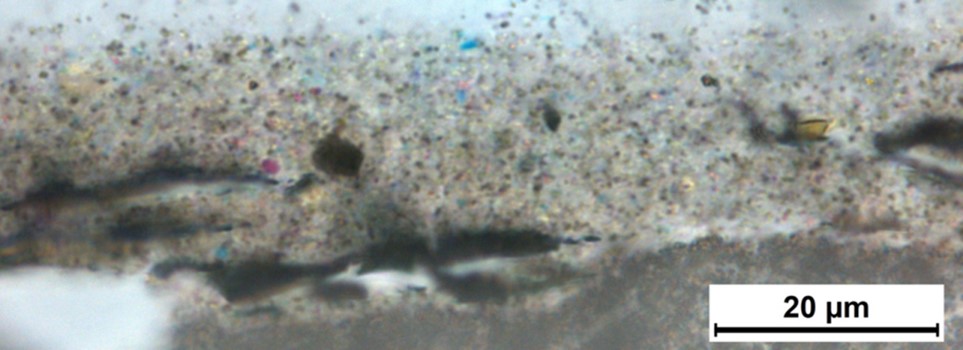
Thin cross section of a paint layer that contains numerous (at least five) pigments.
Following our initial examination, our primary focus in many examinations of art is on the identification of the pigments used to color the object. Why? The date of first use of pigments and many dyes are generally well-established. They range from ancient to extremely modern (as in the case of many industrial and patented pigments). Furthermore, many of the more famous artists (as well as many less famous artists) have known palettes, which sometimes are only derived through the analysis of their artwork. An artist’s palette may change with time, over their career, but often the colorants by an artist are, to a greater or lesser extent, known. Therefore, our identification of pigments can be used to place constraints on whether a painting is consistent with the date or period to which it is attributed. Association of our pigment identifications to an artist’s palette can be subject to interpretation; therefore, we typically supply pigment identification details with the accompanying data to support our identifications, along with dates of first use, leaving artist specific interpretation to subject matter experts.
Our approach to pigment identification begins with an examination of each sample by polarized light microscopy and, as needed, oil immersion microscopy. The latter of which provides some of the highest resolution imaging possible by light microscopy. A critical examination of paint in this manner can reveal that what appears to be a single color on the art is actually composed of more than one type of pigment. For instance, the image above shows at least five different pigments in this brown paint (red, blue, yellow, white, brown/black) – can you find them all?
Using our observations from the initial examinations, we interrogate each sample, using a combination of polarized light microscopy, oil immersion microscopy, fluorescence microscopy, micro-Raman spectroscopy, surface enhanced resonance spectroscopy, scanning electron microscopy-energy dispersive x-ray spectroscopy, microchemical tests, and micro-x-ray fluorescence (as applicable to the case) in order to obtain detailed analytical information that is used to identify the range of colorants present. Each of these pieces of equipment provides different information.
Polarized Light Microscopy
Polarized light microscopy (PLM), oil immersion microscopy, and fluorescence microscopy (see below) each provide a means by which minute particles of pigment can be visualized. The image shown above is a thin sample of a brown paint in which five pigments can be observed. Microscopy offers not only magnification, but a wide range of optical properties such as refractive indices, birefringence, optic sign, and others, which can be used to screen for, observe, describe, and in some cases, specifically identify pigments. In the present day, identifications made by light microscopy are typically supported by independent analytical methods. Light microscopy can also provide insight into the shape and size distribution of pigment grains, which can give indications as to whether a pigment was hand ground or precipitated in an industrial process. The presence of impurities and inclusions can provide further indications as to whether a pigment is naturally (that is, mined) or synthetic. In some instances, the identification of such impurities is helpful to constrain or identify the ultimate source of naturally occurring pigments.
Fluorescence microscopy, such as the image of sactolith® pigment shown below, can provide further indicators of a pigment’s presence and identity. In this instance, the bright green fluorescence is a strong indicator of the presence of zinc sulfide (sactolith®).
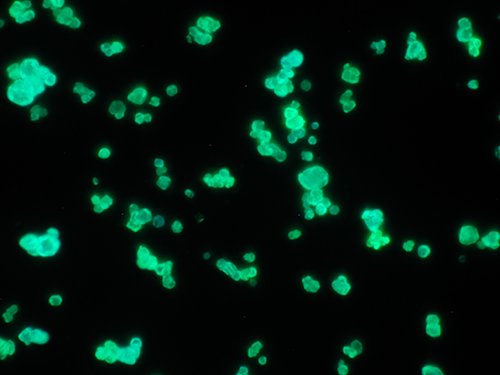
Sachtolith® (zinc sulfide) pigment particles as observed under wide band ultraviolet excitation.
Scanning Electron Microscopy and Elemental Analysis
Identification of the elements that compose a pigment often represents a key step in identifying or supporting the identification of a pigment. At Microtrace, we typically utilize energy dispersive X-ray spectroscopy coupled to a scanning electron microscopy (SEM-EDS) to conduct most elemental analyses.
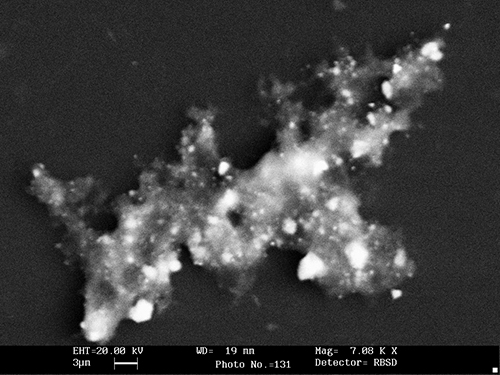
Backscatter SEM image showing heavy pigment particles (bright white particles) in an organic matrix. Note that these particles are on the order of 1-3 micrometers (approximately 1/100 of the width of a hair on your head).
This approach provides high imaging resolution and image contrast that permits us to identify individual components within a sample. In the image shown above, we can resolve individual pigment grains, of which the larger ones in this image are on the order of 3 micrometers and some of the finer particles are only hundreds of nanometers in size. This image, collected with a backscatter electron detector, also illustrates that we can often find particles with atomically heavier elements, which typically appear brighter than the surrounding matrix under these imaging conditions.
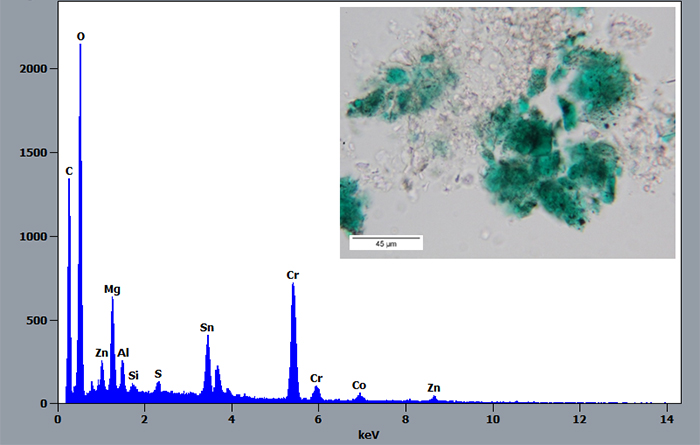
Elemental analysis of a green pigment by SEM-EDS. The spectrum shows the elements detected in a small area of the particle shown in the inset image. Note that the inset image is a PLM image, which is shown to illustrate the color of the sample analyzed here.
With this detailed imaging, it is possible to focus our analysis on individual pigment particles to determine their individual elemental compositions. Shown above is an EDS spectrum from a green pigment. This spectrum shows the presence of, among other elements, magnesium (Mg), tin (Sn), chromium (Cr), and zinc (Zn). This teaches us various lessons. First, the pigment sample appears largely green; however, the elemental composition cannot be combined into a single pigment, which indicates that there must be multiple colorants present. Interpretation of this spectrum suggests the presence of a chromium pigment such as a chrome oxide, which happens to be green, and perhaps a cobalt-tin bearing pigment, which is also green. This is consistent with the data, but is not definitive to identify the pigments present. This illustrates one of the challenges with an analysis based solely upon elemental analysis by either XRF or SEM-EDS.
Elemental analysis does not provide chemical or crystallographic information. In lay terms, elemental analysis does not provide information about the arrangement and bonding of atoms. In the above case, a logical interpretation of the data suggests an answer (which turns out to be correct); however, there are many cases where logical interpretation of elemental data does not provide a likely answer. For example, the presence of titanium and oxygen typically indicates the presence of titanium dioxide; however, elemental analysis cannot make the critical distinction between rutile and anatase (the two most common polymorphs, or structural arrangements, of titanium dioxide). This distinction can have a major impact on an interpretation of the age of a painting, for example. Finally, elemental analysis provides little to no insight into the composition of purely organic pigments (that is, those composed of some combination of carbon, oxygen, hydrogen, and often nitrogen or sulphur).
A note about XRF and handheld XRF units. It is not uncommon to find “expert analyses” of art made by pointing a handheld XRF gun at a painting. While handheld XRF can certainly provide elemental information to help to identify pigments, we have been involved in more than one case where handheld instruments alone have led to wholly incorrect and misleading conclusions. Why? XRF is not particularly sensitive to lighter elements and the spatial resolution of XRF is generally ten to one thousand times coarser than SEM-EDS (micrometer scale vs tens of micrometers for a micro-XRF and millimeters for a handheld XRF). As a result, elements such as aluminum and silicon are not particularly easy to detect, and when they are detected, they appear much less prevalent than heavier elments present at much lower levels (when judging by peak heights). And, of course, wholly organic colorants are effectively invisible to both micro-XRF and handheld instruments.
XRF does have certain benefits, it is non-destructive, it can be portable, and with certain instrumentation (non-portable), it can be used to map the elemental composition of an entire painting. Like SEM-EDS, these maps can help to identify pigments, and it can, at times, reveal underlying paintings or alterations. While we utilize micro-XRF at our laboratory for specific circumstances, we typically find that SEM-EDS permits us to obtain more detailed information.
Raman Spectroscopy
As discussed above, elemental analysis provides important insight into the composition of a pigment, particularly for inorganic pigments. However, elemental analysis does not provide chemical or structural information about the arrangement and bonding of atoms. To this end, we utilize Raman microspectroscopy and Fourier transform infrared microspectroscopy (FTIR or IR). These microanalytical methods utilize monochromatic light (a laser) and infrared radiation (heat) to probe the molecular or crystallographic structure of a pigment. The two methods are complementary as physics proves that certain molecules respond better to one type of probe over the other. In the broadest sense, Raman spectroscopy typically provides a broader range of information about colorants, while FTIR spectroscopy provides more detail about binders (see next section). However, in reality, each method can provide information about both binders and colorants; however, in practice, we have found that a combination of these techniques proves to be the most useful to elucidate the maximum amount of information from a sample.
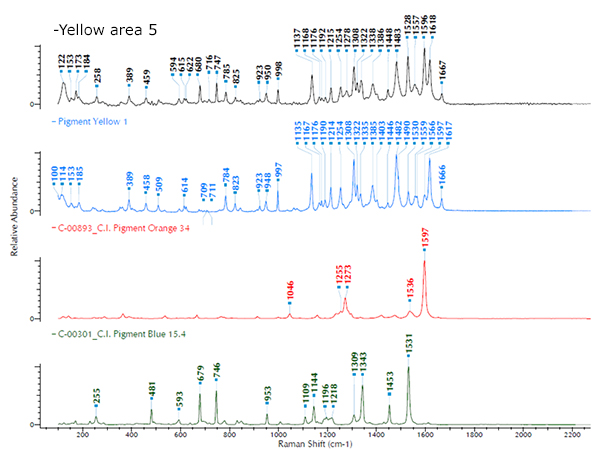
Raman spectrum of a yellow paint. Interpretation shows that this spectrum, collected from a volume of about 10 cubic micrometers, contains information from three different pigments: a blue, yellow, and orange. Little to no information concerning the binder of this paint is detectable in the Raman spectrum.
In the example shown above, a Raman spectrum (top) was collected using a red laser (785 nm) from a minute area within a small sample of yellow paint. Interpretation of the spectrum shows the presence of multiple colorants mixed within a relatively small area. In this example, identified pigments include Pigment Blue 15 (phthalocyanine blue), Pigment Orange 34 (a disazopyrazolone), and Pigment Yellow 1 (Hansa Yellow G) were each identified. Raman spectroscopy is a powerful tool for identifying pigments, but it comes with certain caveats and limitations. For instance, certain pigments don’t give a useful spectrum (often due to fluoresence). In other instances, the Raman signal from the pigment may be obscured by other components in the sample (such as a binder or more strongly scattering pigments/filler) causing difficulties in uniquely identifying a pigment within a group of closely related pigments. For such reasons, interpretation requires not only an extensive database of pigments, but also knowledge of pigments, their chemistry, and their spectra so that one not only knows that a reference spectrum matches, but whether there are other colorants that give similar spectra (and we have found plenty that do). The point of this discussion is to illustrate that careful sampling technique, properly selected analysis, and strong interpretation can confidently extract a great deal of information from a sample.
Binder Identification
The polymer that holds the pigment together is known as a binder. Common binders in paintings include oils and acrylic, but of course, a much wider range of binders has been used, including gum arabic and tempera (protein-based), to name a few. The identification of these binders can be helpful for various reasons. They can be checked against the media an artist is known to have used. Since the use of different binders has changed with time, their identity can be checked against the period in which an artist painted. They can be used to determine if a painting has been retouched or restored. Binders can be identified through a combination of wet-chemical tests (such as solubility), spectroscopy (FTIR), or mass spectrometry (pyrolysis GC-MS).
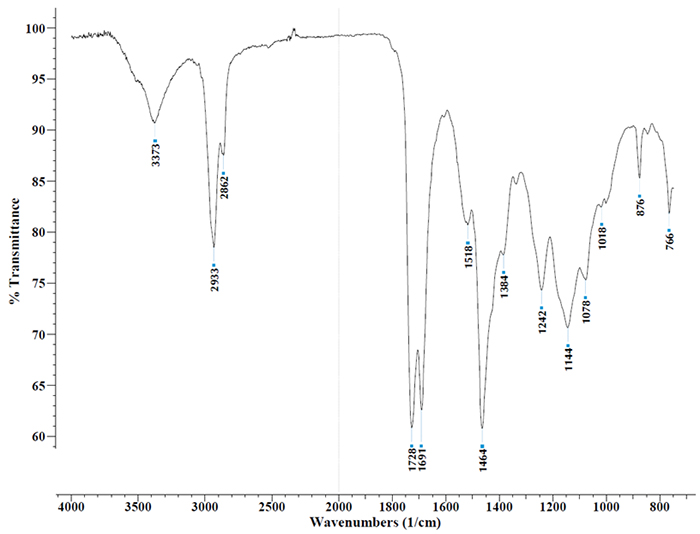
FTIR spectrum collected from a gray paint, which has been identified as a styrene modified acrylic urethane.
The spectrum shown above was collected from a gray paint. There are several means by which the spectrum can be interpreted, including searching the spectrum against commercially purchased reference libraries or privately developed reference libraries based on our physical reference collections, or utilizing published identification charts. Manual interpretation of this spectrum identifies it as a styrene-modified acrylic urethane. This is a modern paint, which has applications in the automotive industry, particularly in aftermarket or refinish applications. Oil and alkyd based paints can be identified by FTIR spectroscopy; however, such identifications by FTIR are sometimes limited. As such, when necessary, we also utilize pyrolysis GC-MS to obtain more detailed chemical information about a binder. Typically, analysis of the binder is not part of our initial analysis of paintings unless specifically requested or dictated by a client-specified task. Why? Since most analyses are conducted to support authentication efforts, we find that the composition of pigments can provide a more specific set of constraints on the question of authenticity. This is due to the fact that there is a wider range of colorants compared to binder compositions.
Paper and Wood Identification
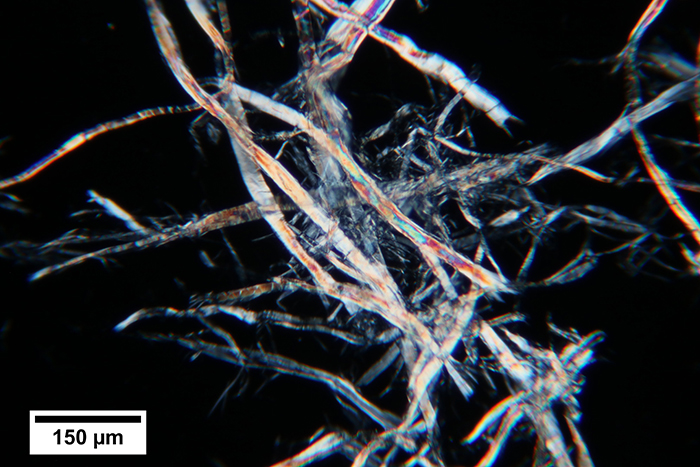
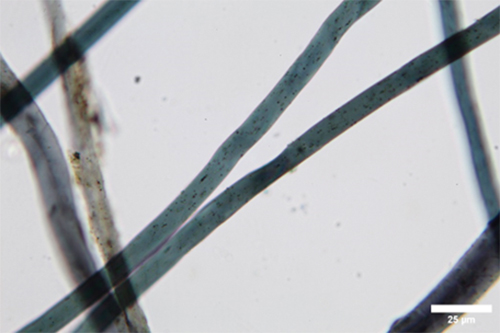
Vegetable fibers comprising a paper sample from an 18th century manuscript.
The canvas, stretcher, and even frame provides further information that can be useful in exploring the provenance of a painting. For various documents and collectibles, such as letters and baseball bats, identifying the paper or wood can probative. Often, stetchers, paper, and substrates such as the canvas are composed of naturally occurring materials, though manmade materials such as synthetic fibers and metal may be encountered. Natural products are typically identified through a classification process based upon microstructural morphology (plant anatomy). This is typically conducted by light microscopy and various types of staining. For instance, it is possible to determine the type of paper fibers (hardwood/softwood and genus/species), identify wood (to genus and sometimes species), or the type of plant from which a vegetable fiber arises (grass, cotton, hemp, linen, etc.). In the image above, the paper fibers have been identified as a bast fiber, hemp (Cannabis sativa).
Cross section analysis
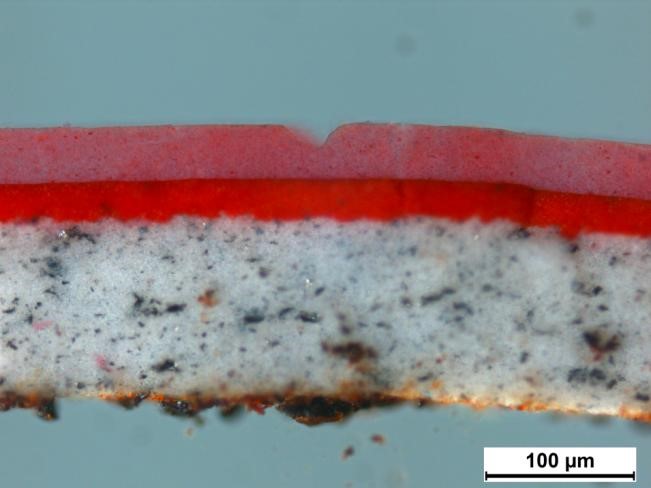
Cross section of a multi-layered paint. In this case, an automotive paint.
Cross sectional analysis is typically used in later stage analyses of art. We have prepared and polished or cut thousands of cross sections to include paintings, ink, wood, and many other materials. The stratigraphy (layer structure) can be helpful in understanding the processes used by an artist, or clearly indicate an overpaint or restoration. We have the capabilities to prepare polished mounts (useful for high solids paints such as artistic and architectural paints) and thin sections for industrial paints and polymers. For example, we have explored the relationship of signature ink to varnishes, to understand whether a signature was applied above or below a varnish layer in an object.
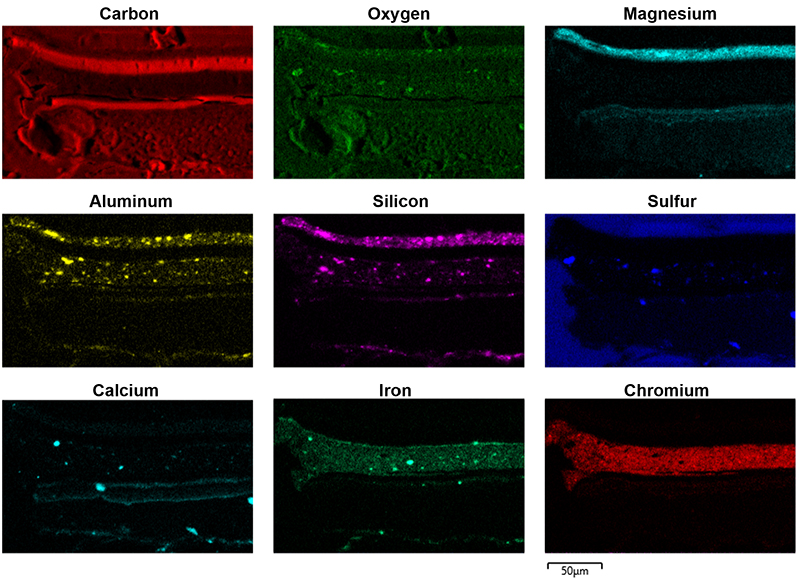
Elemental map, collected by SEM/EDS, showing spatial distribution and relationship of elements in the various layers of a multi-layered paint.
In other instances, we have used cross sections to study the elemental composition of a sample. Shown above is an elemental map of a multi-layered paint sample in cross section. This elemental map permits us to see, for example, that silicon and aluminum are associated, which indicates the presence of kaolinite. Iron and chromium are present in the same layer, while magnesium and silicon are elevated in another layer. This distribution permits us to explore information in the layer structure. The spatial relationship of elements help us to identify components within the sample. This can be helpful for studying underpaintings, restorations, and an artists process.
Ink and Dye Identification
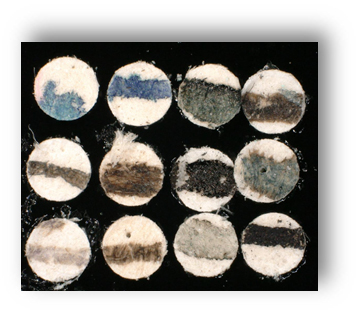
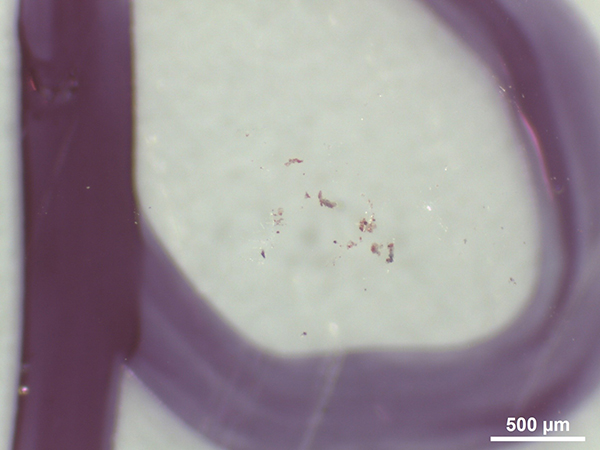
Ink punches from various historical (pre-ball point pen) documents. For scale, each plug is 1 mm in diameter.
Dyes are a colorant that have chemically bonded to a substrate such as paper or fabric. Inks and fabrics can be, and typically are, colored with dyes. That said, both can also be pigmented. We have studied inks in great detail – both modern and historical formulations. We have also studied dyes on fabrics in forensic casework, conservation questions, and in forensic research. Our colorant reference collection consists of thousands of dye samples, which has helped us to explore means by which to identify dyes. We have also synthesized older ink formulations. Shown above are various plugs of ink collected from a series of historical documents in our internal reference collections. These ink plugs, along with many others, were characterized by various methods to explore the properties of older inks.
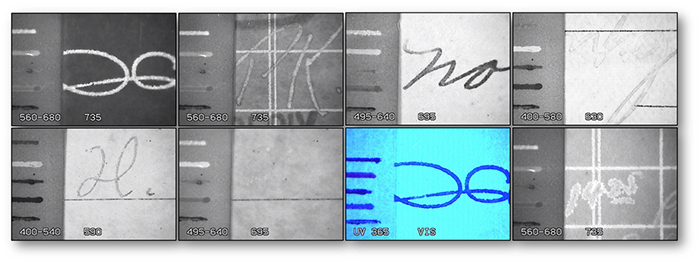
Examination of ink by various excitation and emission wavelengths. This image shows a range of properties exhibited by historical inks.
Ink characterization often starts with a basic examination by alternative light sources. The images above show the response of several historical ink samples to specific combinations of excitation wavelengths of light. The response of ink to these varied conditions permits them to be compared and, in some cases, classified. Older writing inks stem from only a few basic ingredients that include iron tannates (iron gall), logwood, carbon (India), aniline, and alkaline). These were produced using a range of recipes, all stemming from these base components. Over time, it became more common to modify the inks with additional dyes. Eventually entirely new formulations were developed. Our staff have extensively studied ink chemistry, both internally, and under mentorship from some of the world’s most prominent ink chemists.
Dyed polyester fibers in transmitted, plane polarized light.
An analytical scheme for identification of inks and dyes typically moves from the initial examination to infrared and Raman spectroscopy as well as elemental analyses. For Raman spectroscopy, a variant known as SERS (surface enhanced Raman spectroscopy), which utilizes a colloidal metal, can be used to improve a signal that is often overshadowed by fluorescence. However, dye analysis often requires more detailed chemical characterization, which often begins with extraction – the process of separating the colorant from the paper or fabric. Since, a dyed object or ink, can, and often does, include more than one dye, a separation process known as chromatography is often used to separate out and purify individual colorants from the mixture. This chromatography can be conducted on a plate (thin layer chromatography) or in an instrument such as an ultra performance liquid chromatography system. Once separated, the individual dyes can be probed with various methods to identify them – typically Raman or infrared spectroscopy or by a high resolution mass spectrometry approach. Modern methods such as UPLC-HRMS afford the means by which a dye can be very specifically identified. Such approaches can be time consuming, but we have successfully applied them to identify dyes in criminal, industrial, and civil forensic cases.
Debris and Unknown Substances
Everything discussed thus far relates to paint and art. Yet art can consist of many unusual, sometimes unknown, media and materials. Our laboratory was founded, over 30 years ago, for the purpose of identifying unknown materials. In addition to the benefits this offers to studying pigments, a wide variety of other materials can be studied and identified. In our lab, in the cultural heritage realms, we have studied cremains, bones, ivory and hair. We have been asked to identify unknown deposits and residues on a wide range of substrates. This has included material from accidents and dust to concerns over toxic preservation agents (such as arsenic compounds used for preservation).
Transmission Electron Microscopy and Beyond
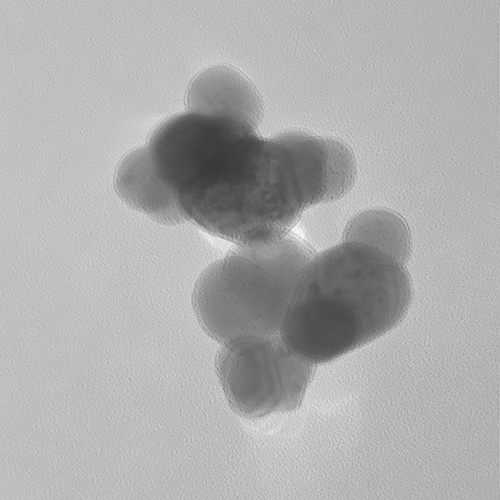
TEM image of the anatase polymorph of titanium dioxide pigment (Pigment White 6). Each grain is on the order of 200-300 nanometers in diameter.
The methods described to this point have been applied in many, many projects to obtain practical results in a relatively short period of time (typically a few weeks to a few months). There are certainly means by which all of the above analyses can, and have been, taken further. For instance, academic researchers continually push the bounds of each method to increasingly smaller scales. Researchers use advanced data treatments to extract further information from samples. While many of the analyses described above can be taken further, our staff at Microtrace have developed what we believe to be a reasonable balance between detail and efficiency. That said, there are numerous instances in which we have had the opportunity to take an analysis further. In forensic cases, we have identified specific colorants by high resolution mass spectrometry. In patent litigation, we have explored the particle size and features of pigment particles on the nanoscale. In research, we have sliced open micrometer scale toner particles to study their internal structure. In the Vinland Map analysis (not conducted by Microtrace), the shape and size distribution of anatase crystals indicated the presence of a commercially produced manmade pigment. All of this is possible and, in the correct circumstances, useful; however, these further analyses require increasing amounts of time and effort. For this reason, such analyses are typically reserved for specific questions that arise as follow-up questions to initial analyses.
Collectibles, Statues and Other Media
Not all artwork involves the characterization of pigments, dyes, or inks. We have examined a wide range of media and cultural artifacts including Indian headdresses (warbonnets), textiles, idols, statues, vessels, and buildings. Our analyses of these materials consists of detailed characterization and identification of natural and synthetic fibers, human and animal hairs, glasses, bronze, concrete and ceramics, among many other materials. As specialists in the identification and characterization of materials, we have helped our clients understand issues ranging from “what is it made of?” to “is a toxic substance such as arsenic or asbestos present?” to “what materials do I need to faithfully restore this?” Regardless of your object or goal, we will help you to understand what a scientific analysis might be able to provide.
Reporting
Our goal is to provide a narrative, illustrated report that contains a detailed explanation of our approach, results, and supporting data. Our reports typically include a section of narrative text that describes our analysis, the data we have obtained, and interpretations we have drawn from that data. This is supported by a section that typically includes images that detail the location from which a sample was collected, before and after sampling images, and photomicrographs that show various features of a sample under the microscope. Supporting data, in the form of spectra are also provided in the report. Generally speaking, it is our goal to ensure that our results are presented in a manner such that a lay audience can understand the results, while sufficient supporting detail is included to withstand scientific and legal scrutiny. Unless other arrangements are made, remaining subsamples are not kept; however, all supporting information is retained, per our data retention policies.
Litigation and Expert Testimony
Much of our casework has the potential for legal involvement. As such, our analyses are conducted in an ISO 17025 accredited laboratory and we are prepared to support our results. In addition, we are often hired to conduct a critical review of expert reports from other laboratories in the course of legal investigations. Our knowledge of analysis, instrumentation and materials permit us to conduct detailed reviews and advise our clients of the strengths and weaknesses of other scientific analyses.
How to proceed
If you made it this far, congratulations! This is just a small slice of what we can, and have, provided to clients worldwide for over thirty years. Hopefully, this has provided you with useful information, as well as, an appreciation for our deep knowledge and passion for conducting the analysis of fine art, cultural heritage objects, and collectibles at the highest level. If you have an object that you are interested in studying, please contact us with a brief description of your item and the types of information you would like to learn about it.
How May We Help You?
Contact usto discuss your project in more detail.